
RO4003C vs RO4350B — When the Lower Df Justifies the Same Process Cost
Home » RO4003C vs RO4350B — When the Lower Df Justifies the Same Process Cost
Table of Contents
Rogers RO4003C and RO4350B are both hydrocarbon ceramic laminates in the Rogers RO4000 series. Both process on standard FR4-compatible equipment — no plasma activation, standard drill parameters, up to 3 lamination cycles, compatible with RO4450F bondply for hybrid stackups. The single meaningful difference is Df: RO4003C at 0.0027 vs RO4350B at 0.0037 — a 27% reduction in dissipation factor. This guide answers the practical question: at what frequency and trace length does this 27% Df difference produce enough insertion loss improvement to justify specifying RO4003C over RO4350B? For material stock and ordering, see Rogers PCB manufacturer.
Side-by-Side Specification Comparison
| Property | RO4350B | RO4003C |
|---|---|---|
| Dielectric constant Dk (10GHz) | 3.48 ±0.05 | 3.38 ±0.05 |
| Dissipation factor Df (10GHz) | 0.0037 | 0.0027 — 27% lower |
| Thermal conductivity | 0.69 W/m·K | 0.71 W/m·K |
| CTE (x,y) | 14 ppm/°C | 11 ppm/°C |
| CTE (z) | 32 ppm/°C | 46 ppm/°C |
| Tg (glass transition) | 280°C | >280°C |
| Process compatibility | ✅ FR4-compatible, no plasma | ✅ FR4-compatible, no plasma |
| Max lamination cycles | 3 | 3 |
| Available thicknesses | 0.101–1.524mm (8 options) | 0.203–1.524mm (6 options) |
| Bonding prepreg (hybrid stackup) | RO4450F | RO4450F |
RO4003C and RO4350B are not pin-compatible for a design already laid out on one material. The different Dk values produce different trace widths for the same impedance target. If you switch materials after layout is complete, the impedance will shift and the design must be re-optimized.
Side-by-Side Specification Comparison
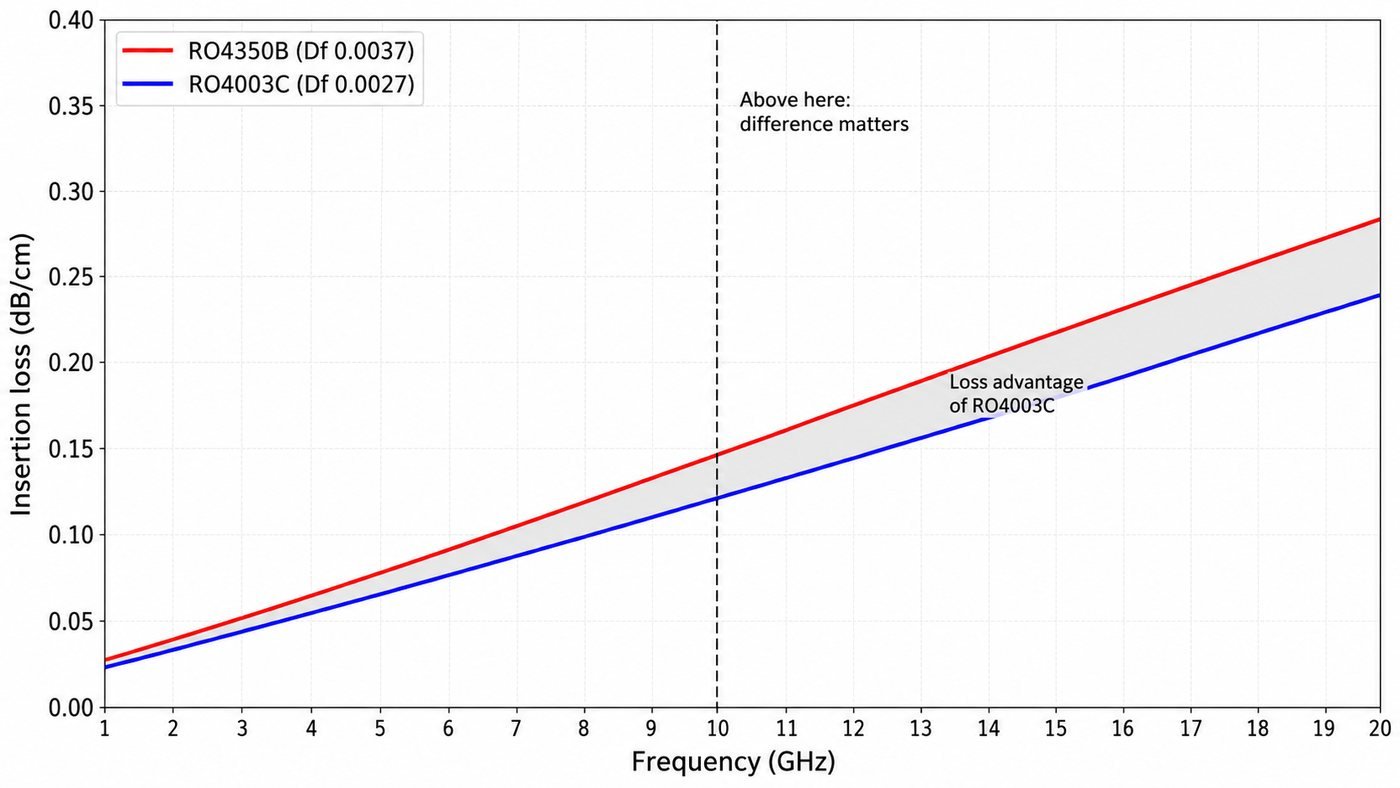
| Frequency | RO4350B (dB/cm) | RO4003C (dB/cm) | Difference (dB/cm) | Over 10cm path |
|---|---|---|---|---|
| 1 GHz | ~0.05 | ~0.04 | ~0.01 | ~0.1 dB — negligible |
| 5 GHz | ~0.12 | ~0.09 | ~0.03 | ~0.3 dB — small |
| 10 GHz | ~0.18 | ~0.13 | ~0.05 | ~0.5 dB — verify budget |
| 15 GHz | ~0.24 | ~0.17 | ~0.07 | ~0.7 dB — significant |
| 20 GHz | ~0.32 | ~0.23 | ~0.09 | ~0.9 dB — significant |
The insertion loss values above are approximate for 50Ω microstrip on 0.508mm substrate with 1oz copper. The 27% lower Df of RO4003C produces a consistent loss advantage at every frequency — but the absolute dB difference scales with frequency. At 5GHz, RO4003C saves approximately 0.03 dB/cm — over a 5cm trace, 0.15 dB total. At 15GHz, the saving is 0.07 dB/cm — over 5cm, 0.35 dB. Whether these numbers are significant depends entirely on your system loss budget.
Side-by-Side Specification Comparison
| Substrate Thickness | RO4350B 50Ω (1oz) | RO4003C 50Ω (1oz) | Difference |
|---|---|---|---|
| 0.254mm | ~0.54mm | ~0.56mm | ~0.02mm — negligible |
| 0.338mm | ~0.72mm | ~0.75mm | ~0.03mm |
| 0.508mm | ~1.05mm | ~1.09mm | ~0.04mm — negligible |
| 0.762mm | ~1.58mm | ~1.64mm | ~0.06mm |
| 1.524mm | ~3.16mm | ~3.28mm | ~0.12mm |
The trace width differences are small — under 0.1mm for all common thicknesses. For designs where trace width is not constrained by element spacing or layout density, this difference is irrelevant. For phased array feed networks where element pitch tightly constrains trace width, the 0.02–0.06mm difference may affect routability at high frequencies — confirm with simulation.
When RO4003C Is Worth Specifying
Designs above 10GHz with loss budget constraints
Below 10GHz, the absolute insertion loss difference between RO4003C and RO4350B over typical trace lengths (under 10cm) is under 0.5 dB. Most RF system budgets can absorb this without affecting performance. Above 10GHz, the difference grows — at 15GHz over a 10cm feed network, RO4003C saves approximately 0.7 dB vs RO4350B. In a receiver front-end where 0.7 dB directly degrades noise figure, this is a meaningful improvement.
Microwave bandpass filters with tight insertion loss specification
In a coupled-line or hairpin bandpass filter, the filter insertion loss in the passband is directly proportional to the substrate Df — lower Df gives lower filter insertion loss. For a filter with a specified maximum passband insertion loss of 1 dB at 10GHz, the difference between RO4350B and RO4003C may determine whether the design passes or fails the specification. This is one of the clearest cases where the Df improvement of RO4003C provides measurable benefit.
Long feed networks in phased array designs
In a phased array PCB with a corporate feed network, the cumulative loss through multiple Wilkinson divider stages adds up. A 4-stage binary divider with 10cm total feed path at 15GHz loses approximately 2.4 dB on RO4350B vs 1.7 dB on RO4003C — a 0.7 dB difference in array efficiency that translates directly to output power and EIRP. For large aperture arrays where feed network loss is a significant fraction of total loss budget, RO4003C is worth the slightly higher material cost.
When RO4350B Remains the Better Choice
- Designs below 5GHz — the insertion loss difference is under 0.1 dB over any practical trace length, and RO4350B’s slightly lower cost is the deciding factor
- Short traces at any frequency — if your longest RF trace is under 3cm, the absolute loss difference is too small to affect system performance
- Thermal management priority — RO4350B (0.69 W/m·K) and RO4003C (0.71 W/m·K) have nearly identical thermal conductivity, but RO4350B’s broader thickness selection (8 options vs 6) may offer more stackup flexibility
- Design already completed on RO4350B — switching to RO4003C requires recalculating all trace widths for the different Dk and re-running impedance verification. The performance gain must justify the redesign cost
Hybrid Stackup Considerations
Both RO4003C and RO4350B use RO4450F bondply at the Rogers-to-FR4 interface in hybrid stackups — the bonding prepreg is the same for both materials. CTE in the z-axis differs slightly (RO4003C 46 ppm/°C vs RO4350B 32 ppm/°C) — for thick multilayer boards with many thermal cycles, confirm via barrel reliability with your fabricator if switching between the two materials in an established design.
| Design Scenario | RO4350B | RO4003C |
|---|---|---|
| Below 5GHz, short traces | ✅ Correct choice | No measurable benefit |
| 5–12GHz, trace <5cm | ✅ Usually adequate | Consider if NF is tight |
| 5–12GHz, trace >10cm | Verify loss budget | ✅ Lower loss worthwhile |
| 12–20GHz, any trace length | Verify budget — may be marginal | ✅ Better choice — 0.7–0.9dB/10cm advantage |
| Above 20GHz | Both inadequate — PTFE required | Both inadequate — PTFE required |
| PA PCB — thermal priority | ✅ 0.69 W/m·K | 0.71 W/m·K — marginally better |
| Filter with tight IL spec | Check if budget allows | ✅ Lower Df benefits filter IL |
| Price-sensitive high volume | ✅ Typically slightly lower cost | Slightly higher — verify with supplier |
RO4350B and RO4003C Both In Stock — 5–7 Day Prototype
Both materials available in standard thicknesses. FR4-compatible process, no plasma activation. TDR impedance verification every lot. RO4450F bondply for hybrid stackups. No MOQ.
Rogers PCB Manufacturer → WhatsAppRequest a PCB Quote
Upload your Gerber ZIP file and project requirements. Our engineering team will review your PCB material, stackup, impedance needs, surface finish, and production quantity before quoting.
Please prepare:
- Gerber files in ZIP format
- PCB material or stackup requirements
- Controlled impedance notes if available
- Prototype or batch production quantity