
mmWave PCB VNA Testing: What Verified Data to Demand Before You Order
Test equipment reality changed this week. On September 25, 2026, Rohde & Schwarz introduced the SAM200 series of solid-state system amplifiers covering 20–53 GHz with up to 4 W saturated output, aimed at Ka-, Q- and V-band satellite, aerospace and 5G component test. Test benches that stopped at 40 GHz now reach past 50 GHz — and buyers are starting to ask their PCB suppliers for measurement data that matches.
Home » 50 GHz PCB » mmWave PCB VNA Testing: What Verified Data to Demand Before You Order
Table of Contents
1. Why TDR Impedance Alone Stops Being Enough Above 20 GHz
<p>TDR-based impedance verification remains the baseline for every RF PCB lot — a ±5% repeatability window on 50 Ω lines (about ±2.5 Ω) is still the right acceptance target for controlled-impedance work. But a TDR result is a time-domain reflection measurement: it verifies the characteristic impedance of the line, not how the board behaves when a signal actually propagates through it. <a href=”https://www.richingpcb.com/why-rf-pcb-fails-impedance-testing/”>A board can pass every impedance check and still fail in the system</a> — the classic cases are worth reviewing before you write your acceptance spec.</p>
<p>At mmWave frequencies, distributed effects dominate: conductor surface roughness raises conductor loss, solder mask over the trace changes the effective Dk, resin-rich or resin-starved zones shift impedance along the line, and any launch discontinuity reflects energy back toward the source. None of these appear as a clean TDR step. Only a swept-frequency VNA measurement — S-parameters from a defined reference plane — reveals them.</p>
| Measurement | What It Verifies | Typical Acceptance Evidence |
|---|---|---|
| TDR impedance | Characteristic impedance of the line, in the time domain (reflection) | ±5% repeatability on 50 Ω lines (about ±2.5 Ω), every production panel |
| VNA S-parameters | Insertion loss (S21), return loss (S11), launch quality and loss slope, in the frequency domain | Swept S21/S11 to the operating band, per batch, from a stated reference plane |
| Both, mapped to lots | Process drift between laminate lots and press cycles | Batch data package with coupon serials mapped to panel and laminate lot serials |
2. The Per-Batch VNA Data Package to Demand
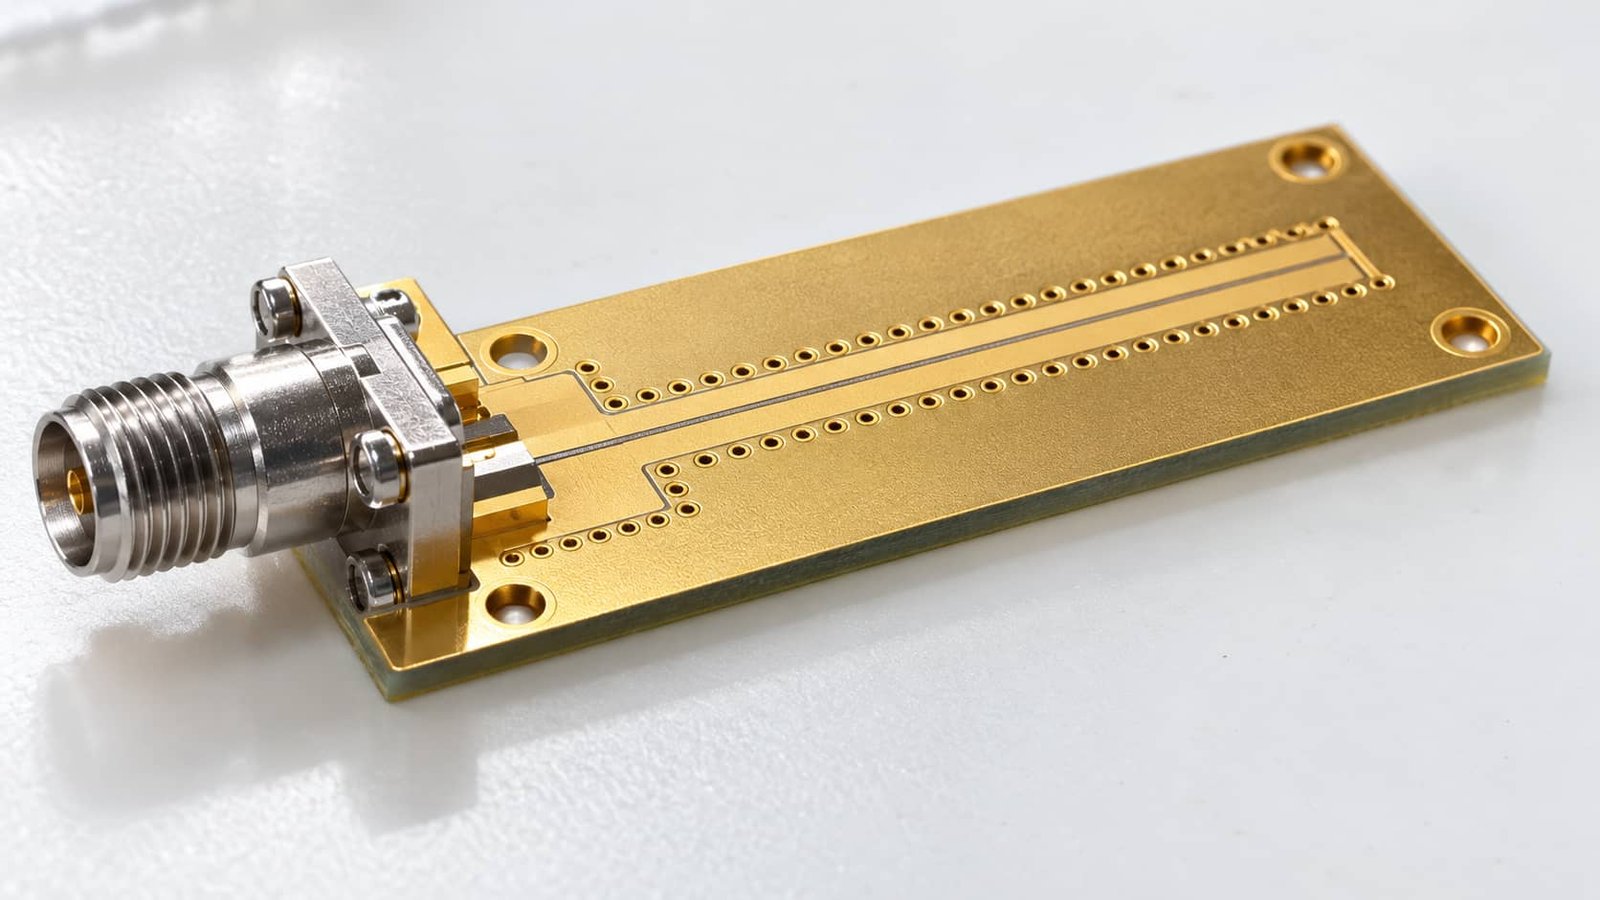
Specify the data package at RFQ stage, not after the first delivery. A production-grade mmWave package includes:
| Per-Batch Data Item | What to Check |
|---|---|
| VNA sweep range | To the board's operating band, not a generic "full sweep" — e.g., up to 50 GHz for a Q-band evaluation board |
| S21 insertion loss | Absolute value and slope vs frequency, compared against the stack-up loss budget set at design time |
| S11 return loss | Launch and line reflections — −10 dB across the band is a common screen; phased-array feeds need tighter |
| Calibration state | Cal kit, connector type and reference plane stated on the report |
| Raw data format | Touchstone (.s2p) files, not screenshots — screenshots cannot be re-analyzed |
| Coupon traceability | Coupon serials mapped to panel serials and laminate lots |
3. Test Coupons: What Makes a mmWave Measurement Trustworthy
A coupon measured with the wrong geometry proves nothing about your board. At mmWave, the coupon must reproduce the production line's critical features: the same copper roughness class, the same solder-mask coverage over the line (or documented removal), the same dielectric layers from the same press cycle, and — critically — the same launch structure the measurement will use.
For panel-level verification, a straight 50 Ω microstrip or GCPW line with a 2.92mm connector launch (rated to 40 GHz; 2.4mm and 1.85mm connectors extend coverage to 50 and 67 GHz respectively) is the workhorse. Ground via fences along the line, back-via'd ground pads and documented edge distance belong on the coupon, not just on the drawing. For probe-based testing instead of connector-based, our mmWave test fixture PCB design guide covers probe pad geometry and de-embedding structures, which follow different rules.
4. Calibration Reference Planes and Connector Launches
A VNA report without a stated reference plane is unreadable. The measurement is only as good as its calibration: SOLT with a verified cal kit, or TRL/LRM lines built into a calibration substrate when launch de-embedding matters. Ask which method was used, with which connectors, and where the reference plane sits — at the connector interface, or de-embedded to the coupon line itself.
Connector launch quality is its own discipline: our RF connector launch design guide covers SMA and 2.92mm transition rules — launch geometry, ground via placement and keep-out distances — that determine return loss before the measurement even starts. For production coupons, keep the launch identical batch to batch: a launch-geometry change shifts return loss in ways that can be mistaken for process drift. At higher frequency classes, purpose-built calibration boards with TRL/LRM coupons become the standard — see how that scales beyond 100 GHz.
5. What Causes Batch-to-Batch Insertion Loss Drift
When S21 curves from consecutive batches diverge, the causes are usually process, not material brand: copper foil roughness class changes (rolled vs electrodeposited, or a foil lot change), solder-mask or resin variation entering the field region, plating thickness on the trace, and press-cycle thickness drift. Our signal-loss-after-fabrication guide breaks down where loss creeps in after the stack-up is fixed.
This is why the acceptance limit should be written as a batch spread — for example, insertion-loss spread of 0.1 dB/inch or less at 28 GHz between consecutive batches — rather than an absolute number that only the first article must meet. A supplier who measures S-parameters on first articles but never on production panels cannot detect these drifts until your system integration does.
6. Red Flags in Supplier mmWave Test Claims
| # | Red Flag | Pass Evidence Instead |
|---|---|---|
| 1 | "Supports mmWave" with no stated frequency limit | Written test-frequency limit per material and stack-up |
| 2 | Only first-article VNA data, nothing per batch | S-parameter report with every shipment |
| 3 | Screenshots instead of raw data | Touchstone (.s2p) files mapped to coupon serials |
| 4 | No calibration method or reference plane on reports | Cal kit, connector and reference plane stated per report |
| 5 | Impedance-only QC behind mmWave-class pricing | TDR + VNA package priced into the batch, not as a surprise surcharge |
The checklist collapses into one question: if your last shipment drifted 0.15 dB/inch at your operating band, when would the supplier have caught it — before or after you did?
7. How a Direct Factory Runs mmWave Verification
For mmWave programs, the supplier’s test capability is part of the product. Riching PCB runs TDR impedance verification on every production panel and VNA S-parameter sweeps on mmWave coupons to 40 GHz and beyond with 2.92mm launches, with the calibration method and reference plane stated on every report and Touchstone files delivered in the batch data package. As a direct factory, coupon results go straight to the process engineers who control press recipes and plating lines — no trading layer in between.
The SAM200’s 53 GHz ceiling is a useful benchmark for your next RFQ: ask every candidate supplier to state, in writing, the highest frequency they actually measure, with which connector and which calibration method — and evaluate the evidence in their data package, not their brochure.
New on this subject
- W-band noise figure measurement on PCB — Y-factor arithmetic, source match uncertainty and the finish that decides 75–110 GHz
- 250 GHz differential probe pads — contact geometry, calibration planes and thermal imaging from −60 to +300 °C
mmWave PCB VNA Testing — Q&A
The acceptance-data questions buyers ask before committing to a 50 GHz-class mmWave PCB order.
What VNA data should I require with every mmWave PCB batch?
Swept S21/S11 to your operating band on a coupon from each production panel, Touchstone (.s2p) raw files, calibration method and reference plane stated on the report, and coupon serials mapped to panel and laminate lot serials.
Is TDR impedance testing enough for mmWave PCB acceptance?
No. TDR verifies characteristic impedance in the time domain; it does not reveal insertion loss, return loss or launch discontinuities. Above roughly 20 GHz, swept VNA S-parameters per batch are the meaningful evidence.
Which connector launch should a 50 GHz test coupon use?
2.92mm connectors are rated to 40 GHz; 2.4mm and 1.85mm extend coverage to 50 GHz and 67 GHz. Hold the launch geometry identical batch to batch.
What batch-to-batch insertion-loss spread is acceptable?
A practical contract limit for low-loss PTFE stack-ups is 0.1 dB/inch or less spread at 28 GHz between consecutive batches, verified on a coupon from each production panel.
Sourcing mmWave PCBs That Survive 50 GHz-Class Verification?
Batch VNA data packages with stated reference planes, Touchstone files, coupon-to-panel traceability and TDR on every lot — from a direct high-frequency PCB factory. Rogers, Taconic and PTFE materials in stock, hybrid stack-ups, 2.92mm launches.
Contact Us → WhatsAppRequest a PCB Quote
Upload your Gerber ZIP file and project requirements. Our engineering team will review your PCB material, stackup, impedance needs, surface finish, and production quantity before quoting.
Please prepare:
- Gerber files in ZIP format
- PCB material or stackup requirements
- Controlled impedance notes if available
- Prototype or batch production quantity