
W-Band Noise Figure Measurement: What the Board Puts in Front of the LNA
W-band noise figure measurement on PCB: Y-factor arithmetic, source match uncertainty, pre-LNA loss and the finish that decides 75–110 GHz performance.
Home » High Frequency PCB » W-Band Noise Figure Measurement: What the Board Puts in Front of the LNA
Table of Contents
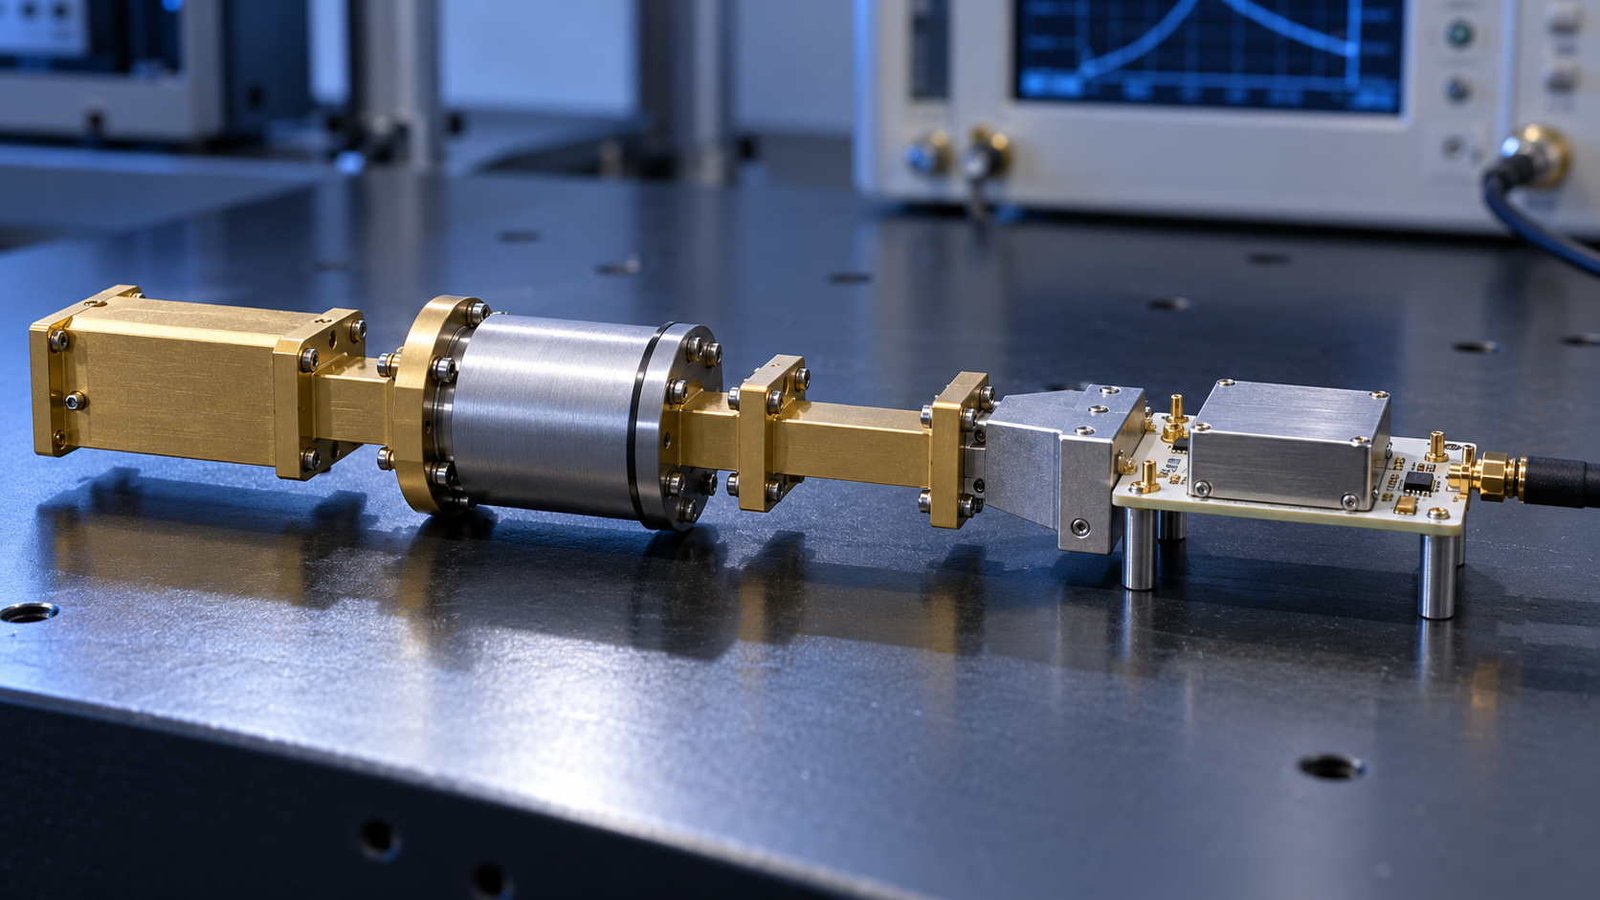
A calibrated W-band noise source does not make a receiver quieter. What it does is make the receiver's noise measurable, and in doing so it moves the argument onto ground where the board has to answer: how much loss sits between the reference plane and the first amplifier, and how well is that loss known.
That is a different question from the one S-parameters answer. A board can show clean return loss to 110 GHz and still add a decibel of noise figure, because 0.50 dB of loss ahead of the LNA adds 0.50 dB of noise figure exactly — no partial credit, no matching trick that recovers it. The measurement chain that reveals this is arithmetic, not magic: a source with a known excess noise ratio, a hot and a cold state, and a Y factor.
This page works the arithmetic with the numbers a 75–110 GHz source actually provides, then turns it into board decisions: finish thickness against skin depth, transition design, coupon design, and the order in which to measure. The S-parameter side of the same problem is covered in our mmWave VNA testing guide, and the launch geometry in the RF connector launch guide.
1. Two Measurements, Two Different Questions
S-parameters are ratios measured at a defined stimulus level. Noise figure is a ratio measured in the absence of a stimulus, and it depends on the noise temperature of every element in the chain. They are not interchangeable, and one does not imply the other: an attenuator has perfect return loss and its own noise figure equal to its attenuation.
| Frequency | λ0 in air | WR-10 guide wavelength | λg/4 | Board structures at this scale |
|---|---|---|---|---|
| 75 GHz | 3.997 mm | 6.477 mm | 1.619 mm | A quarter-wave stub is 1.6 mm — still routable |
| 90 GHz | 3.331 mm | 4.412 mm | 1.103 mm | Feed lengths are phase, not distance |
| 110 GHz | 2.725 mm | 3.229 mm | 0.807 mm | A via barrel is an inductor, a pad is a capacitor |
WR-10 cutoff is 59.01 GHz for the a = 2.54 mm dimension, so the whole band is single-mode by a comfortable margin — the uncertainty comes from the board, not from the guide.
The frequency scale explains why the board becomes the dominant uncertainty above 75 GHz. At 110 GHz a quarter of a free-space wavelength is 0.68 mm; in WR-10 it is 0.807 mm. Dimensions that were routing at 10 GHz are distributed elements here, and the transition between a planar board and a waveguide is not a connector detail but a network that has to be measured.
2. The Y-Factor Arithmetic With Real Numbers
A noise source switches between a cold state (room temperature, ENR defined as 0 dB) and a hot state (ENR above ambient). The receiver measures two output powers; their ratio is Y; and the DUT's noise factor follows from F = ENR / (Y − 1).
| DUT noise figure | Noise factor F | Y (linear) | Y (dB) | Measurement headroom |
|---|---|---|---|---|
| 3.0 dB | 2.00 | 11.00 | 10.41 | Comfortable |
| 5.0 dB | 3.16 | 7.31 | 8.64 | Comfortable |
| 8.0 dB | 6.31 | 4.16 | 6.19 | Usable, but each dB of error is large in relative terms |
Y = ENR / F + 1 with ENR = 13 dB (linear 19.95). A 13 dB source is well matched to the task: a hotter source gives more Y but also more compression in the DUT, and a colder one pushes the measurement into the receiver's own noise.
Two things follow that are easy to miss. First, Y falls as the DUT gets noisier, so the measurement becomes harder exactly where it matters least — a 3 dB LNA is easy to measure, an 8 dB front end is not. Second, ENR appears linearly: NF(dB) = ENR(dB) − 10·log10(Y − 1), so an ENR error of 0.2 dB is a 0.2 dB error in the answer, no matter how good the rest of the setup is.
That linearity is why the source's calibration matters, and why the source's match matters even more — the next section is the one that usually gets skipped.
3. The Uncertainty Nobody Budgets: Source Match
A noise source with a 13 dB ENR and a ±0.2 dB calibration is a well-specified instrument. Its output match is a separate specification, and in this band it is typically around 1.6:1 — which is where the arithmetic gets uncomfortable.
| Uncertainty term | Magnitude | Effect on the reported NF | Controllable by |
|---|---|---|---|
| ENR calibration | ±0.20 dB | ±0.20 dB (exactly — NF is linear in ENR) | Source calibration certificate |
| Source output match, VSWR 1.6:1 | |Γ| = 0.231 | ±0.45 dB | An isolator at the source, or a better-matched source |
| Mismatch loss, same source | 0.238 dB | Systematic bias, not scatter | De-embedding, or an isolator |
| Reference plane error | one connector or transition | Depends on the transition's own match | A shorter path between DUT and reference |
The source's output match contributes more than twice the uncertainty of its ENR accuracy. This is the single most commonly under-budgeted term in a W-band noise figure measurement.
A 1.6:1 match is |Γ| = 0.231. Interacting with a DUT of similar match, the mismatch term swings the reported noise figure by up to ±0.45 dB — more than twice the ENR uncertainty, and in a direction that depends on the phase of a reflection nobody measured. The standard remedy is an isolator between source and DUT, which is why isolator accessories exist as a catalogue item in this band rather than as a custom part.
For a board supplier the practical consequence is a question to ask before quoting a noise-figure number: was the reference plane at the DUT's connector, or at the source's flange? If the transition between them is inside the measurement, its mismatch is part of the result — and if the same transition appears on the board being qualified, the number is partly a measurement of the fixture.
4. The Loss Before the LNA Is the Noise Figure
The Friis cascade has a property that is worth stating plainly: for a lossy element ahead of an amplifier, the noise figure in decibels adds directly. A 0.5 dB line, connector or transition in front of a 3 dB LNA produces a 3.5 dB front end. Nothing downstream can recover it.
| Configuration | Resulting noise figure | Compared with an ideal front end |
|---|---|---|
| LNA alone, 3.0 dB | 3.000 dB | Reference |
| LNA + second stage at 10 dB, 20 dB gain | 3.192 dB | +0.19 dB — the second stage is nearly free |
| 0.1 dB of board loss in front of the LNA | 3.100 dB | +0.100 dB |
| 0.5 dB of board loss in front of the LNA | 3.500 dB | +0.500 dB |
| 1.0 dB of board loss in front of the LNA | 4.000 dB | +1.000 dB — a third of the LNA's advantage is gone |
For a lossy element ahead of the amplifier, F_total = L · F, so the loss in dB adds directly to the noise figure in dB. There is no partial credit: it is the cheapest decibel to lose and the most expensive to buy back.
The contrast with the second stage is the useful part of the table. A 10 dB second stage behind 20 dB of gain costs 0.19 dB; a 0.5 dB transition costs 0.50 dB. The engineering effort should follow that ratio, and in practice it usually does not — because the second stage is a component with a datasheet and the transition is a drawing.
This is also why the low-noise amplifier's own grounding and shielding matter more than its gain: an unstable amplifier is a different problem, but a marginally grounded one has an input match that moves with the bias network, and the noise figure follows the match. The layout conventions are set out in our LNA grounding and shielding guide.
5. What the Board Contributes Above 75 GHz
Three board properties decide the loss at the top of the band, and they are all decided before the layout is finished: the finish, the foil, and the laminate.
| Finish element | Skin depth at 90 GHz | Consequence |
|---|---|---|
| Gold, δ at 90 GHz | 0.2621 µm | A 0.05–0.10 µm immersion gold is a fraction of a skin depth |
| Nickel, δ at 90 GHz | 0.4435 µm | A 3–6 µm ENIG nickel layer is 7–14 skin depths of a 3× more resistive metal |
| Gold at 110 GHz | 0.2370 µm | Thinner still — the finish gets more critical at the top of the band |
| Copper foil roughness | comparable to δ | Roughness becomes a direct loss multiplier, not a second-order effect |
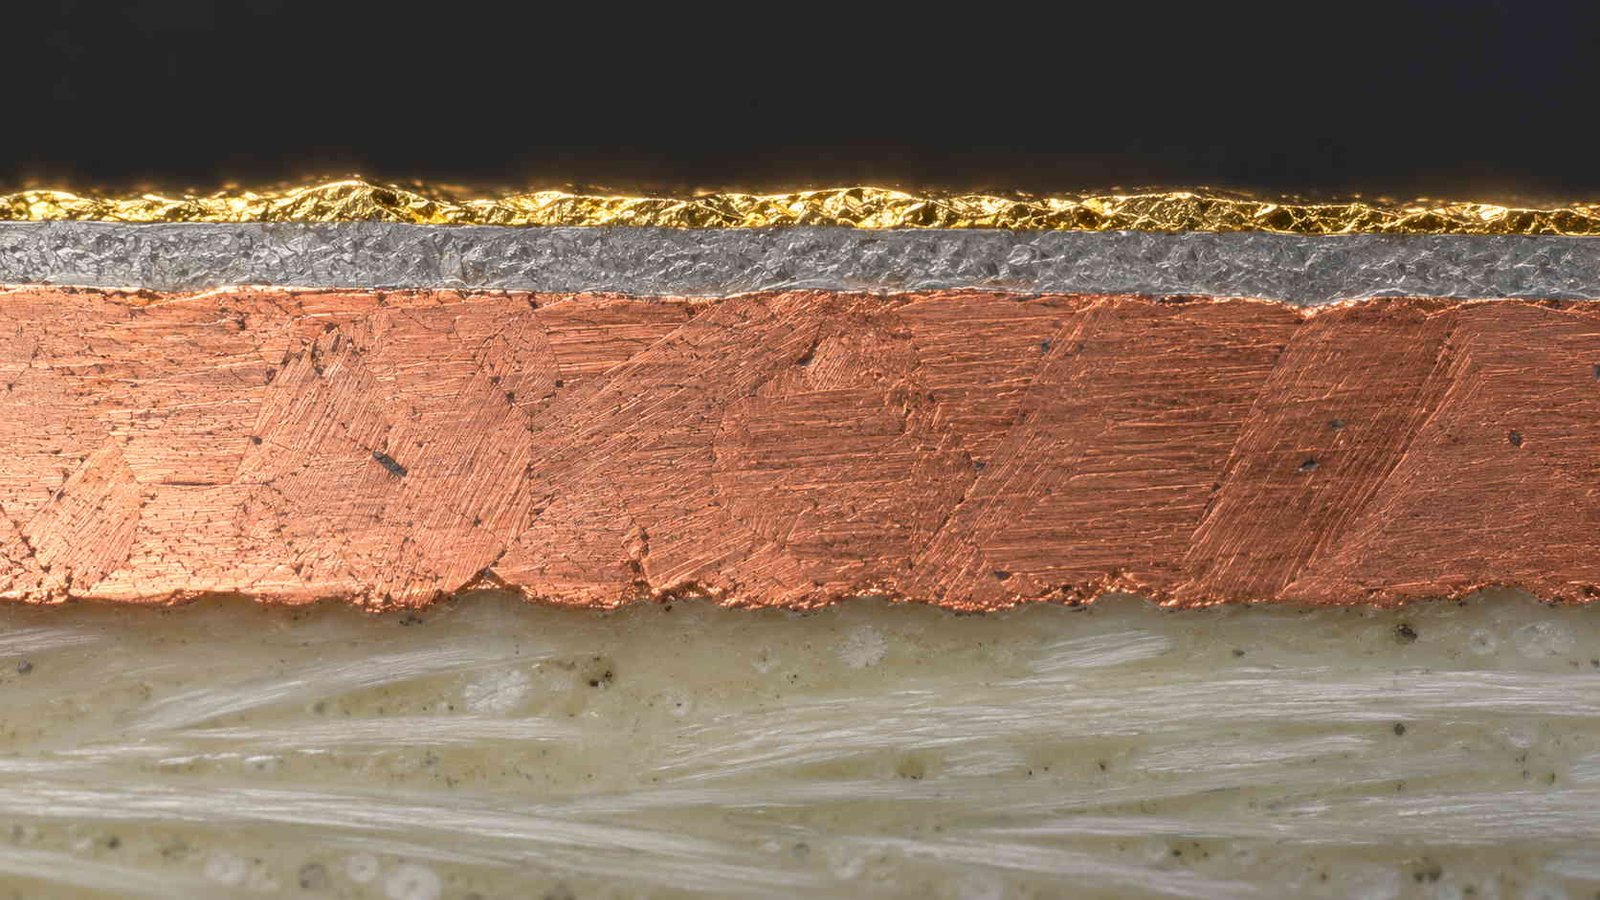
Skin depth is computed from resistivity and frequency. The practical rule for a W-band board: the current must never be forced to flow in the nickel, so the gold must be thick enough or the nickel thin enough — and that decision is made at the finish specification, not in the layout.
The finish is the one that surprises people, because the specification is usually inherited from lower-frequency products. At 90 GHz the skin depth in gold is 0.262 µm, so an immersion gold of 0.05–0.10 µm is a fraction of a skin depth and the layer underneath is fully involved. Nickel's skin depth at the same frequency is 0.444 µm — so a 3–6 µm nickel layer under the gold carries the current in a metal with about three times the resistivity of copper. That is a conductor loss multiplier applied to every millimetre of line, decided by a finish call rather than by a design decision.
Foil roughness behaves the same way. When the roughness is comparable to the skin depth, the current path lengthens and the loss rises; at 90 GHz this is not a second-order correction. The options and their trade-offs are in our RF surface finish and copper thickness and line width guides; the laminate side is in the high-frequency materials section.
6. A Verification Chain Without a W-Band Laboratory
Most board suppliers do not own a 110 GHz noise-figure setup, and there is no reason they should. What matters is that the measurement chain is designed so that the expensive step is short and the cheap steps are conclusive.
| Tier | What is measured | What it proves | Where it is done |
|---|---|---|---|
| 1 | TDR / impedance coupon per panel | The stackup is what the design asked for | In-house |
| 2 | S-parameters to 110 GHz on a launch coupon | The transition works and the loss budget is real | In-house or partner lab |
| 3 | Noise figure at the band centre | The pre-LNA loss is within budget | Third-party W-band lab |
| 4 | Noise figure at band edges | The finish and the transition behave across the band | Third-party W-band lab |
A factory without W-band noise measurement can still own tiers 1 and 2, and can supply the structures that make tiers 3 and 4 meaningful. What it cannot do is substitute a simulation for tier 3.
The logic is that each tier retires a risk that would otherwise contaminate the next. Impedance per panel retires the stackup question. A launch coupon measured to 110 GHz retires the transition question. Only then does a noise figure measurement mean something about the board rather than about the fixture. Skipping to tier 3 with an unproven transition produces a number that cannot be attributed.
The coupon design is the part that decides whether this works, and it is the same argument made about calibration structures in the 110–145 GHz calibration board work: a coupon that does not carry the real launch geometry measures a different board. The fixture side is in the RF and mmWave test fixture guide.
7. The W-Band Board RFQ Checklist
Related reading
- 250 GHz differential probe pads — contact geometry, calibration planes and thermal imaging from −60 to +300 °C
- 1 mm switch-connector RF test point DFM — pad geometry, ground-return inductance and probe keep-out at 15 GHz
- mmWave PCB VNA testing — S-parameter measurement, calibration and de-embedding
- RF test and measurement equipment for PCB work — what each instrument actually constrains
Eight lines, and two of them are usually missing from the first enquiry.
| # | Item to specify | Why it decides the measurement |
|---|---|---|
| 1 | Band of interest and the noise-figure target | Sets the finish, the transition and the coupon design |
| 2 | Reference plane definition | Where the measurement is claimed to start — before or after the transition |
| 3 | Connector or waveguide interface | The transition is part of the loss budget, not a fixture detail |
| 4 | Finish, with layer thicknesses | Nickel thickness is a loss specification at 90 GHz |
| 5 | Copper foil type and roughness | A direct multiplier on conductor loss above 75 GHz |
| 6 | Laminate Dk / Df and thickness | Guided wavelength, and therefore every length on the board |
| 7 | Coupon design that carries the real transition | A straight-line coupon does not prove the launch |
| 8 | Evidence package: which tiers, which lab | Turns the claim into a record |
Eight lines. Lines 2 and 8 are the ones that most often go missing — and they are the two that decide whether a number can be defended.
The pattern: a W-band board is specified in finish thicknesses and reference planes, and proved by a coupon that carries the real transition. The noise source makes the result visible; the board decides what the result is.
W-Band Noise Figure Measurement — Frequently Asked Questions
Why noise figure is not S-parameters, what ENR 13 dB buys, source-match uncertainty, gold thickness at 90 GHz and how to qualify a W-band board without a W-band lab.
Why measure noise figure instead of S-parameters at W-band?
Because they answer different questions and cannot be converted into each other. S-parameters describe how a network scatters a signal at a defined power level; noise figure describes how much noise the network adds, which depends on the noise temperature of every element and not on its gain alone. A board can have excellent return loss and still destroy the system noise figure, because 0.5 dB of loss in front of the LNA adds that much noise figure regardless of how well it is matched.
What does an ENR of 13 dB actually buy?
It sets the measured Y factor. With ENR 13 dB, a 5 dB noise-figure DUT produces Y = 7.31, which is 8.64 dB of measurable difference between hot and cold states — comfortably above the receiver's own fluctuation. An 8 dB DUT still gives 6.19 dB, which is usable but where every tenth of a decibel of setup error becomes visible. The source is chosen so the Y factor stays large for the DUTs actually being tested.
My noise source is specified at VSWR 1.6:1. Does that matter?
More than its ENR accuracy does. A 1.6:1 output match corresponds to |Γ| = 0.231, and interacting with a similarly mismatched DUT that produces up to ±0.45 dB of mismatch uncertainty — against ±0.20 dB from the ENR calibration. The usual remedy is a Faraday isolator at the source output, which is exactly what the noise-source families in this band provide as an accessory.
How thick should the gold be on a W-band board?
Thick enough that the current does not reach the nickel underneath, or thin enough — with a finish that has no nickel at all — that the question disappears. At 90 GHz the skin depth in gold is 0.262 µm, so a 0.05–0.10 µm immersion gold is a fraction of one skin depth and the underlying layer matters completely. Nickel's skin depth at the same frequency is 0.444 µm, so a 3–6 µm nickel layer carries the current in a metal with roughly three times the resistivity of copper.
Does a second amplifier stage matter at W-band?
Barely. With a 3 dB, 20 dB-gain first stage and a 10 dB second stage, the cascade comes out at 3.192 dB against 3.000 dB for the first stage alone — 0.19 dB of penalty. What costs real noise figure is the loss before the first stage, where a 0.5 dB loss adds 0.5 dB of noise figure with no partial credit.
Can a W-band board be qualified without a W-band noise-figure setup?
Not fully, but most of the risk can be retired before that step. Impedance coupons and a launch coupon measured to 110 GHz prove the stackup and the transition; noise figure at the band centre then confirms the pre-LNA loss budget. The mistake is to treat the simulation as a substitute for the noise measurement rather than as the reason to design a coupon that makes it quick.
Building a board that has to meet a noise-figure target at 75–110 GHz?
Send the band, the noise-figure target and where you define the reference plane. We will set the finish and its layer thicknesses against skin depth, choose foil roughness and laminate against the loss budget, design the transition and a coupon that carries it, and ship the evidence package — impedance coupons per panel, launch S-parameters and cross-section — with the boards to IPC Class 3.
Contact Us → WhatsApp: +86 137 6047 3650Request a PCB Quote
Upload your Gerber ZIP file and project requirements. Our engineering team will review your PCB material, stackup, impedance needs, surface finish, and production quantity before quoting.
Please prepare:
- Gerber files in ZIP format
- PCB material or stackup requirements
- Controlled impedance notes if available
- Prototype or batch production quantity