
PCB Material Comparison Chart: Rogers vs PTFE vs Taconic vs F4B
A PCB material comparison chart for RF laminates: how to read the Dk, Df and tolerance columns, Rogers vs PTFE glass vs Taconic vs F4B grades, thermal and mechanical data, and relative price bands.
Table of Contents
A PCB material comparison chart puts the electrical, thermal and mechanical parameters of laminate grades side by side so that the same parameter can be read across several materials at once. For RF and microwave work the parameters that decide a design are dielectric constant and its tolerance, dissipation factor, the dielectric thicknesses the material is actually offered in, glass transition temperature, Z-axis coefficient of thermal expansion, water absorption and thermal conductivity.
This page is built as a set of charts rather than as a narrative. Each grade is listed with the value, the test frequency and the tolerance that belong to it, and every table states what it does not cover. The charts are grouped by laminate family: hydrocarbon ceramic grades, ceramic-loaded PTFE grades, glass-reinforced PTFE grades and the F4B PTFE range. Our high frequency PCB materials section holds the same families grouped by application instead of by parameter.
Values below are typical datasheet figures at the stated test condition. Where a number could not be confirmed against a datasheet it is left out rather than estimated.
1. How to Read a PCB Material Comparison Chart
Most material comparisons go wrong in the same way: a single column — usually Df — is read in isolation and the rest of the datasheet is skimmed. In practice every parameter in a laminate datasheet becomes the deciding parameter in some situation, and knowing which situation is the useful part.
| Parameter | What it decides | When it becomes the limiting item |
|---|---|---|
| Dk (design value) | Guided wavelength, therefore element and trace dimensions | When the board outline, the element size or the enclosure is already fixed and cannot grow. |
| Dk tolerance | Lot-to-lot repeatability of resonant frequency, phase and impedance | Array panels, narrowband filters and phase-matched feed networks, where every unit has to sit on the same frequency. |
| Df (loss tangent) | Insertion loss per unit length, and the heat that loss turns into | Long feed networks, high-Q resonators, and any design above roughly 10 GHz where the loss budget is already tight. |
| Available dielectric thicknesses | The impedance and bandwidth you can actually build | Millimetre-wave designs, where only a few thin gauges exist and a thickness that is not offered forces a redesign. |
| Tg (glass transition) | Dimensional stability through reflow and at high ambient temperature | Assemblies that go through more than one reflow, or equipment that runs hot for long periods. |
| Z-axis CTE | Stress on plated through-hole barrels through thermal cycling | High layer counts, thick boards, and products that must pass severe thermal cycling. |
| Water absorption | Dk and Df stability in humid or condensing environments | Outdoor, marine and unsealed equipment, where the board sees humidity over years. |
| Thermal conductivity | How quickly heat spreads away from the trace or device | Power amplifiers, transmit arrays and any high duty-cycle design. |
Read this table first. Each column in the charts that follow exists to answer one of these eight questions, and the right-hand column is the situation in which that parameter stops being a detail and starts deciding the design.
2. Dk, Df and Dk Tolerance: What Each Column Decides
Dk sets the guided wavelength, and therefore the physical size of every element, trace and stub on the board. Df sets how much of the signal is converted to heat per unit length. Dk tolerance sets how much all of that moves between one production lot and the next.
Of the three, the tolerance is the one most often estimated instead of calculated, so it is worth putting a number on it. For a resonant structure with fixed dimensions:
Δf / f = − ½ · ΔDk / Dk
Applied to the tolerances published for common grades, the same style of tolerance value produces very different frequency uncertainty:
| Design Dk | Datasheet tolerance | Relative frequency shift (½ · ΔDk/Dk) | Shift at 10 GHz | Shift at 24 GHz | Example grade family |
|---|---|---|---|---|---|
| 3.48 | ±0.05 | 0.72 % | 72 MHz | 172 MHz | RO4350B-class hydrocarbon |
| 3.38 | ±0.05 | 0.74 % | 74 MHz | 178 MHz | RO4003C-class hydrocarbon |
| 3.00 | ±0.04 | 0.67 % | 67 MHz | 160 MHz | RO3003-class PTFE ceramic |
| 2.20 | ±0.02 | 0.45 % | 45 MHz | 109 MHz | RT/duroid 5880-class PTFE glass |
| 2.55 | ±0.05 | 0.98 % | 98 MHz | 235 MHz | F4BM255-class PTFE |
| 6.15 | ±0.15 | 1.22 % | 122 MHz | 293 MHz | RO3006-class ceramic-filled |
| 10.2 | ±0.25 | 1.23 % | 123 MHz | 294 MHz | CER-10-class ceramic-filled |
| 4.50 | ±0.25 (±5.6 %) | 2.78 % | 278 MHz | 667 MHz | Standard FR-4 |
Calculated from the relation Δf / f = −½ · ΔDk / Dk, which holds for a resonant structure whose dimensions are fixed. The point of the table is that the same tolerance number means very different things at different Dk, and that the frequency shift scales with the operating frequency.
Two conclusions follow. First, a tolerance that looks tight in absolute terms is not equally tight on every material — ±0.05 on a 2.2 Dk laminate is a larger relative uncertainty than ±0.05 on a 3.5 Dk laminate. Second, the shift scales with frequency, so the same board is twice as sensitive at 24 GHz as it is at 12 GHz. How Dk and Df translate into loss and impedance on a finished board is covered in our article on how Dk and Df affect high frequency PCB performance.
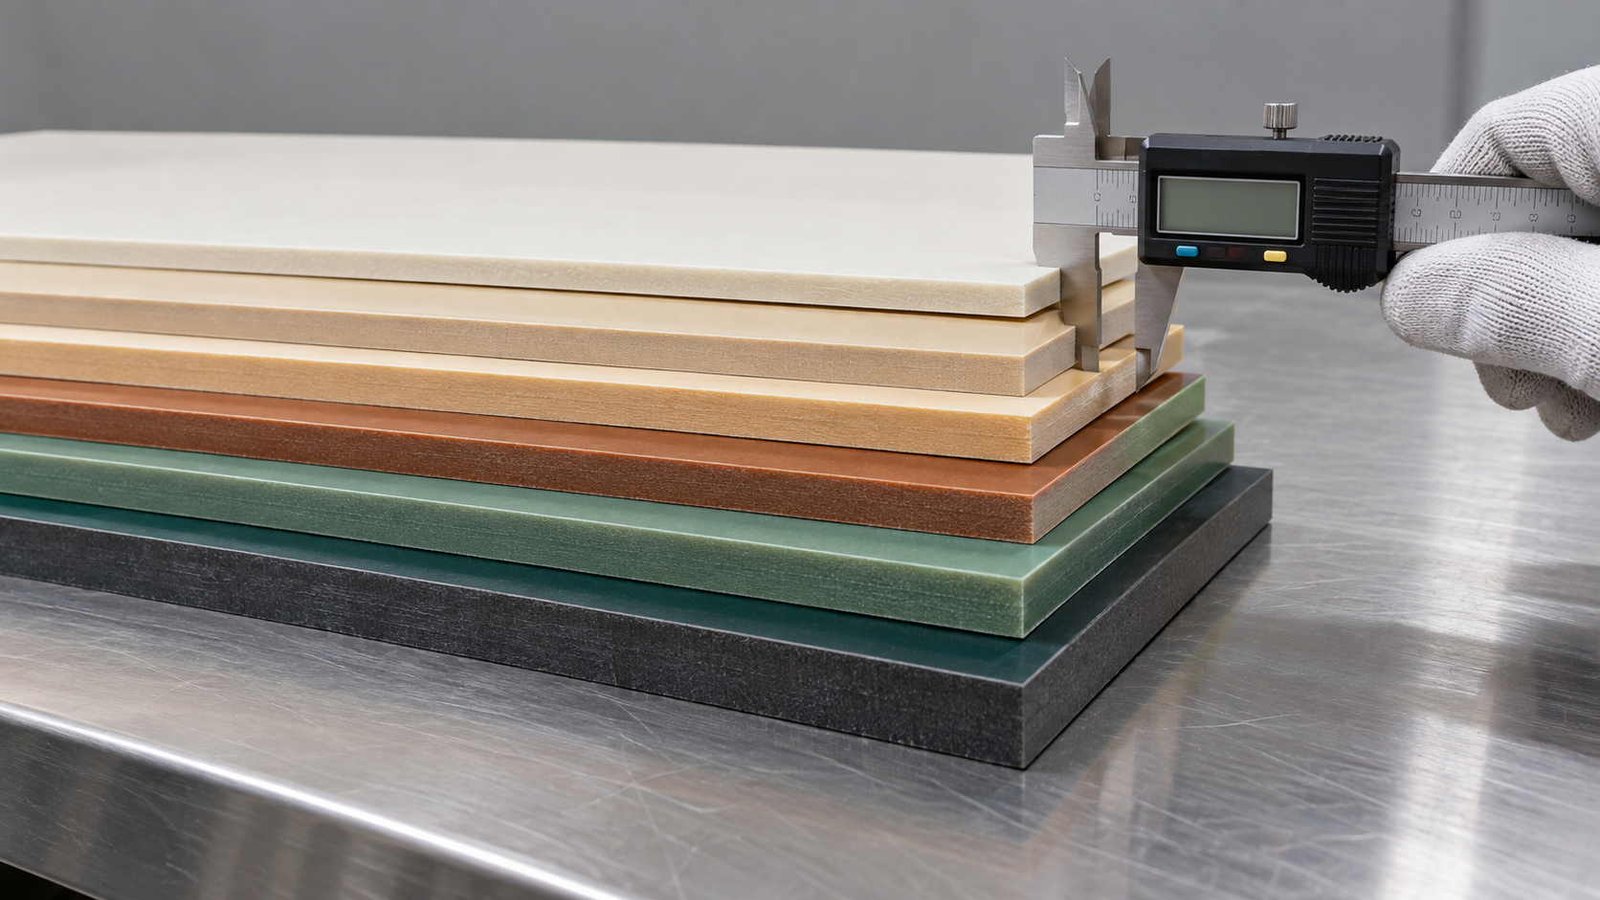
3. Rogers Laminates: Hydrocarbon and Ceramic-PTFE Grades
The first chart covers the grades that carry most RF and microwave work. They split into two process families: hydrocarbon ceramic laminates, which run on FR-4-compatible lines, and ceramic-loaded PTFE laminates, which need hole-wall activation before plating.
| Grade | Family | Type | Dk @ 10 GHz | Df @ 10 GHz | Dielectric thickness options (mm) |
|---|---|---|---|---|---|
| RO4350B | RO4000 | Hydrocarbon ceramic | 3.48 ±0.05 | 0.0037 | 0.101 / 0.168 / 0.254 / 0.338 / 0.422 / 0.508 / 0.762 / 1.524 |
| RO4003C | RO4000 | Hydrocarbon ceramic | 3.38 ±0.05 | 0.0027 | 0.203 / 0.305 / 0.406 / 0.508 / 0.813 / 1.524 |
| RO3003 | RO3000 | PTFE ceramic | 3.00 ±0.04 | 0.0010 | 0.127 / 0.254 / 0.508 / 0.762 / 1.524 |
| RO3006 | RO3000 | PTFE ceramic | 6.15 ±0.15 | 0.0020 | 0.127 / 0.254 / 0.635 / 1.270 |
| RO3010 | RO3000 | PTFE ceramic | 10.2 ±0.30 | 0.0022 | 0.127 / 0.254 / 0.635 / 1.270 |
| RO6010 | RO6000 | Ceramic PTFE | 10.2 ±0.25 | 0.0023 | 0.127 / 0.254 / 0.635 / 1.270 / 1.905 / 2.540 |
The hydrocarbon rows and the PTFE rows behave differently at the press, which is why the table separates them by type rather than by Dk. Hydrocarbon grades are processed on FR-4-compatible lines; PTFE grades need hole-wall activation before plating and a controlled lamination sequence.
Two columns deserve a note. The thickness list is a property of the grade, not a suggestion — a design that needs 0.254 mm on a grade that starts at 0.305 mm has to be re-dimensioned. And the Dk column is the process value at 10 GHz; the design value published for the same laminate is higher, and it is the design value that impedance calculations use. The full grade list with application notes is on our Rogers materials page.
4. PTFE Glass-Reinforced Laminates: RT/duroid and Taconic Grades
The lowest loss figures in the whole chart come from this family, because the matrix is PTFE rather than a resin. What varies between grades is the glass style and the ceramic loading, which together set the Dk — and that is why one family spans 2.17 to 10.0 with the same low-loss character.
| Grade | Supplier range | Dk @ 10 GHz | Df @ 10 GHz | Standard thickness options (mm) |
|---|---|---|---|---|
| RT/duroid 5880 | Rogers RT/duroid | 2.20 ±0.02 | 0.0009 | 0.127 / 0.254 / 0.381 / 0.508 / 0.787 / 1.575 / 3.175 |
| RT/duroid 5870 | Rogers RT/duroid | 2.33 ±0.02 | 0.0012 | 0.127 / 0.254 / 0.381 / 0.508 / 0.787 / 1.575 / 3.175 |
| TLY-5A | Taconic | 2.17 ±0.02 | 0.0009 | 0.09 / 0.13 / 0.25 / 0.51 / 0.79 / 1.58 / 2.36 |
| TLP-5 | Taconic | 2.20 ±0.02 | 0.0009 | 0.09 / 0.13 / 0.25 / 0.51 / 0.79 / 1.58 / 2.36 |
| TLY-5 | Taconic | 2.22 ±0.02 | 0.0009 | 0.09 / 0.13 / 0.25 / 0.51 / 0.79 / 1.58 / 2.36 |
| TLY-3 | Taconic | 2.33 ±0.02 | 0.0012 | 0.09 / 0.13 / 0.25 / 0.51 / 0.79 / 1.58 / 2.36 |
| TLA-6 | Taconic | 2.65 ±0.05 | 0.0017 | 0.76 / 1.45 |
| RF-35 | Taconic | 3.50 ±0.05 | 0.0018 | 0.25 / 0.51 / 0.76 / 1.52 |
| RF-60A | Taconic | 6.50 ±0.15 | 0.0038 | 0.25 / 0.64 / 0.79 / 1.27 / 1.52 / 3.18 |
| CER-10 | Taconic | 10.0 ±0.25 | 0.0035 | 0.28 / 0.64 / 0.76 / 1.19 / 1.58 / 3.18 |
These grades share one property: a PTFE matrix, which is what produces the low Df figures. The Dk is set by the glass style and the ceramic loading, which is why the same family spans 2.17 to 10.0.
The tolerance column is the practical sorting key here: the 2.17–2.33 grades are published at ±0.02, the 3.50 grade at ±0.05, and the ceramic-loaded 6.50 and 10.0 grades at ±0.15 and ±0.25. Reading the Dk column alone would hide that. Grades grouped by application are listed on our PTFE materials and Taconic materials pages.
5. F4B Grades: Dk From 2.20 to 6.15
The F4B range is a PTFE laminate family in which the Dk is set by ceramic loading, so it covers a continuous span of Dk values through one process route. All models share the same thickness list, which makes the thickness column a constant and leaves Dk as the variable.
| Model | Dk | Df | Standard thickness options (mm) | Reinforcement |
|---|---|---|---|---|
| F4BM220 | 2.20 ±0.04 | 0.0010 | 0.127 / 0.254 / 0.508 / 0.762 / 1.016 / 1.524 / 2.0 / 3.0 | PTFE / glass |
| F4BM255 | 2.55 ±0.05 | 0.0013 | 0.127 / 0.254 / 0.508 / 0.762 / 1.016 / 1.524 / 2.0 / 3.0 | PTFE / glass |
| F4BM265 | 2.65 ±0.05 | 0.0015 | 0.127 / 0.254 / 0.508 / 0.762 / 1.016 / 1.524 / 2.0 / 3.0 | PTFE / glass |
| F4BM300 | 3.00 ±0.05 | 0.0017 | 0.127 / 0.254 / 0.508 / 0.762 / 1.016 / 1.524 / 2.0 / 3.0 | PTFE / glass |
| F4B350 | 3.50 ±0.05 | 0.0025 | 0.127 / 0.254 / 0.508 / 0.762 / 1.016 / 1.524 / 2.0 / 3.0 | PTFE / glass |
| F4BTM400 | 4.00 ±0.08 | 0.0030 | 0.127 / 0.254 / 0.508 / 0.762 / 1.016 / 1.524 / 2.0 / 3.0 | PTFE / ceramic |
| F4BTM440 | 4.40 ±0.10 | 0.0033 | 0.127 / 0.254 / 0.508 / 0.762 / 1.016 / 1.524 / 2.0 / 3.0 | PTFE / ceramic |
| F4BTM615 | 6.15 ±0.12 | 0.0045 | 0.127 / 0.254 / 0.508 / 0.762 / 1.016 / 1.524 / 2.0 / 3.0 | PTFE / ceramic |
The F4B family is a PTFE laminate range in which the Dk is set by the ceramic loading, giving a continuous choice from 2.20 to 6.15 with the same overall process route. The wider tolerance at higher Dk is a property of ceramic loading, not of the process.
Note how the tolerance widens as the loading increases: ±0.04 at Dk 2.20 rising to ±0.12 at Dk 6.15. That is characteristic of ceramic-loaded systems in general, not of one supplier, and it is the reason a high-Dk grade is normally chosen for the geometry it allows rather than for its frequency accuracy. Grade-by-grade data is on our F4B materials page.
6. Thermal and Mechanical Parameters
Electrical parameters decide whether the design works on paper. Thermal and mechanical parameters decide whether it still works after assembly and after a few years in the field, and they are the columns most often skipped.
| Parameter | RO4350B | RO4003C | RO3003 | Standard FR-4 |
|---|---|---|---|---|
| Material type | Hydrocarbon ceramic | Hydrocarbon ceramic | PTFE ceramic | Epoxy glass |
| Dk @ 10 GHz | 3.48 ±0.05 | 3.38 ±0.05 | 3.00 ±0.04 | ≈4.5 (grade dependent) |
| Df @ 10 GHz | 0.0037 | 0.0027 | 0.0010 | ≈0.020 |
| Dk temperature coefficient | +50 ppm/°C | +40 ppm/°C | +13 ppm/°C | Grade dependent, >200 ppm/°C |
| Tg | >280 °C | >280 °C | PTFE, no Tg transition in the normal range | 130–180 °C |
| CTE, X / Y | 10 / 12 ppm/°C | 11 / 14 ppm/°C | 17 / 17 ppm/°C | 14–17 ppm/°C |
| CTE, Z axis | 32 ppm/°C | 46 ppm/°C | 24 ppm/°C | 50–70 ppm/°C |
| Thermal conductivity | 0.69 W/m·K | 0.71 W/m·K | 0.50 W/m·K | ≈0.25 W/m·K |
| Water absorption | 0.06 % | 0.04 % | 0.04 % | 0.10–0.20 % |
| Density | 1.86 g/cm³ | 1.86 g/cm³ | 2.10 g/cm³ | ≈1.85 g/cm³ |
| Hole-wall activation before plating | Not required | Not required | Required (plasma) | Not required |
| Typical lamination cycle limit | 3 | 3 | 2 | 3+ |
Notes on reading this table. Values are typical datasheet figures at the stated test condition. Water absorption is quoted at 48 hours at 50 °C by the method used by the supplier, and suppliers using a different test method publish a slightly different number for the same laminate. The Tg row is not comparable across PTFE and epoxy systems: epoxy laminates have a glass transition in the range they operate in, while a PTFE matrix has none in that range, which is the reason the row mixes a number with a statement rather than listing four numbers.
Z-axis CTE is the number to watch on boards with many layers or thick construction: it sets how much the plated barrel is stretched relative to the copper that lines it, and mismatch there is what produces barrel cracks in thermal cycling. Thermal conductivity sets how fast heat leaves the trace under a high duty-cycle transmitter. Neither of these shows up in an electrical simulation, which is why both belong in the specification even when the design is electrically straightforward.
7. Relative Price Band
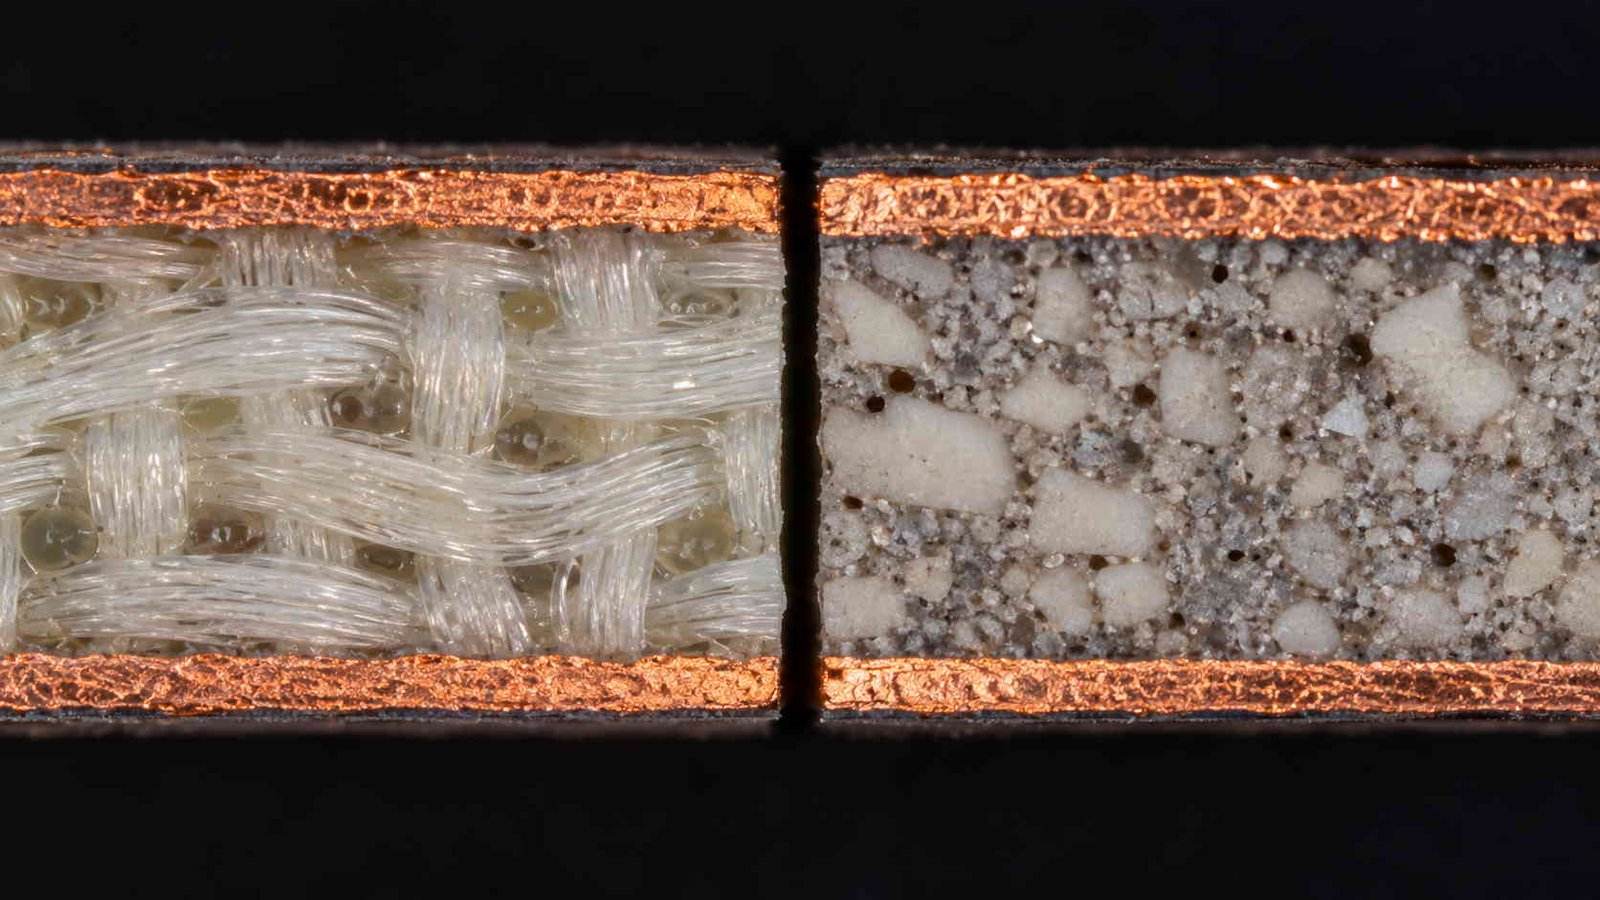
Price is a consequence of the columns above, not an independent variable, so it belongs at the end of the chart rather than the beginning. The figures below are indicative ranges for prototype and small-volume orders and they move with the material market.
| Item | Indicative relative index | What drives the position |
|---|---|---|
| Standard FR-4, raw laminate | 1× (baseline), USD 8–15 / m² | Commodity supply, high volume, many suppliers. |
| RO4350B-class hydrocarbon laminate | 10–15× FR-4, USD 120–180 / m² | Hydrocarbon/ceramic formulation, tight Dk control, lower production volume than FR-4. |
| RO4003C-class hydrocarbon laminate | Roughly +20–35 % over RO4350B | Halogen-free formulation and a tighter loss specification. |
| PTFE ceramic laminate (RO3003-class) | 15–20× FR-4, USD 180–280 / m² | PTFE matrix plus ceramic loading, and a smaller number of qualified producers. |
| PTFE process premium | Adds 15–25 % to board cost | Hole-wall activation, controlled lamination and tighter drilling parameters are process steps, not material cost. |
| PTFE scrap rate | 5–15 % (FR-4 typically 1–3 %) | Smear, hole-wall adhesion and lamination deformation on PTFE panels. |
| Finished board, multi-layer | 3–8× an equivalent FR-4 board | Material plus process plus yield, weighted by how many layers carry the high-frequency laminate. |
Indicative ranges for prototype and small-volume orders, in USD, before tax and freight. Laminate pricing moves with the material market and with the specific gauge and copper weight, so treat the index as a planning tool rather than a quote. Selection should be driven by the electrical and process requirements in the charts above; price follows from them.
The board-level multiple in the last row is larger than any single material multiple because it includes process and yield, not only laminate. For the cost structure in more detail, including how gauge, copper weight and quantity move the number, see our article on Rogers PCB price compared with FR-4.
8. Reading the Chart by Frequency Band
A final way to use the charts above: instead of choosing a material first, identify which column is likely to become the limiting item at the band you are working in, and read that column across the candidate grades.
| Band | Parameter that typically becomes the constraint first | Why |
|---|---|---|
| Below about 500 MHz | Not an RF laminate question at all | Trace lengths are short relative to the wavelength, so insertion loss and Dk tolerance rarely decide the design. |
| 500 MHz – 3 GHz | Df, once the trace gets long | Loss accumulates with length; on short traces the dielectric contribution stays small. |
| 3 – 12 GHz | Df and Dk tolerance together | Loss per unit length is now material-dependent, and narrowband structures start to care about lot-to-lot Dk. |
| 12 – 40 GHz | Dk tolerance, plus available thickness | Elements and filters are narrowband and small, so a Dk shift is a larger share of the band, and only a few gauges exist. |
| Above 40 GHz | Surface finish, copper roughness and thickness control | Conductor loss and dimensional tolerance become comparable to or larger than dielectric loss. |
| Any band, high duty cycle transmit | Thermal conductivity and Z-axis CTE | Heat has to leave the board, and repeated thermal excursion loads the plated holes. |
This is not a material recommendation table — it is a table of which column in a datasheet stops being a detail. Two laminates with similar Dk and Df can still behave differently once thickness availability, thermal conductivity or process requirements enter the picture.
When two candidates are still level after that pass, the tie is normally broken on process rather than on electrical data — which of the two the factory can hold to thickness, whether hole-wall activation is available in-house, and how many lamination cycles the build needs. Those three questions decide more projects than the third decimal place of Df does.
PCB Material Comparison — Frequently Asked Questions
How to read the charts above, and what a datasheet can and cannot tell you about a finished board.
What is a PCB material comparison chart?
A PCB material comparison chart lists the electrical, thermal and mechanical parameters of laminate grades side by side so that the same parameter can be read across multiple materials at once. The parameters that matter for RF and microwave work are dielectric constant and its tolerance, dissipation factor, the dielectric thicknesses actually offered, glass transition temperature, Z-axis coefficient of thermal expansion, water absorption and thermal conductivity. A useful chart states the test frequency for Dk and Df and the test condition for the thermal values, because a number without its condition is not comparable.
Why does Dk tolerance matter more than the Dk value itself?
Because the design value is a number you plan around, while the tolerance is the uncertainty that stays with the product for its whole life. For a resonant structure with fixed dimensions the frequency shift is half the relative Dk change, so a ±0.05 tolerance on a 3.48 Dk laminate is about ±0.72 %, which is ±72 MHz at 10 GHz. On a narrowband element or on an array where every unit has to sit on the same frequency, that shift consumes a real part of the band. A wider tolerance also means the second production lot behaves differently from the first, which is a repeatability problem rather than an accuracy problem.
Do datasheet values predict the performance of a finished board?
Only partly. Datasheet Df is measured on a specific test method at a specific frequency, and the board you build adds copper roughness, a solder mask layer, plated holes and a finite ground plane. Datasheet Dk is a process or design value depending on the column read, and the value that sets impedance is the one for the dielectric thickness and copper weight you actually specify. Datasheet CTE is measured over a stated temperature range. The charts above describe the material; the board has to be verified on coupons.
Which materials do these charts cover, and why is FR-4 included?
The charts cover the laminate families most often specified for RF and microwave work: hydrocarbon ceramic grades, ceramic-loaded PTFE grades, glass-reinforced PTFE grades, and the F4B PTFE range. FR-4 appears because most RF assemblies contain FR-4 layers somewhere — power distribution, digital control or mechanical structure — and because its parameters set the reference point against which Dk tolerance is usually judged. Its loss tangent and Dk stability are the reason it is not used for RF signal layers above a few hundred megahertz.
Want the parameters verified on the material you are specifying?
Send us the grade, the dielectric thickness and the band. We confirm the datasheet values against the lot we will actually build from, check that thickness is available in the gauge your design needs, and quote fabrication on that material — with coupon impedance data if the design is controlled-impedance.
Contact Us → WhatsApp: +86 137 6047 3650Request a PCB Quote
Upload your Gerber ZIP file and project requirements. Our engineering team will review your PCB material, stackup, impedance needs, surface finish, and production quantity before quoting.
Please prepare:
- Gerber files in ZIP format
- PCB material or stackup requirements
- Controlled impedance notes if available
- Prototype or batch production quantity